

AdGrow

Book a call

Results

The work,
and what it returned.

Accounts we work in every day, and the words of the people who own them.

Brands we work with

  • VMP Consult logo
  • EliteCare Medical Center logo
  • Sarab logo
  • Muslim Lifestyle Store logo
  • Euphoria Perfumes logo
  • alqamees logo
  • ProAlign Smile Shop logo
  • Resin Art Hub logo
  • mas organic logo
  • Expert Leaders Medical Center logo
  • Al Waha Bird Control logo
  • Platinum Medical Center logo
  • Genové Dermatologics logo
  • YesPasta logo
  • Luxury Mansion logo

E-commerce

Stores, measured in revenue.

Google Ads campaigns dashboard showing 90 day results in AED for a UAE store
AED 213,502 conversion value on AED 39,372 spend. 5.1x, 90 days, in AED.

E-commerce · Google

AED 213,502 back on AED 39,372 spend.

Ninety days of Search, Shopping and Performance Max on a UAE craft-supplies store. 5.1x account-level conversion value / cost. 573 conversions. Part of a sustained 4x–5x ROAS held on this account for over two years.

  • 5.1x account-level conv. value / cost · 573 conversions
  • Sustained 4x–5x ROAS on AED 18K–20K/month over 2+ years
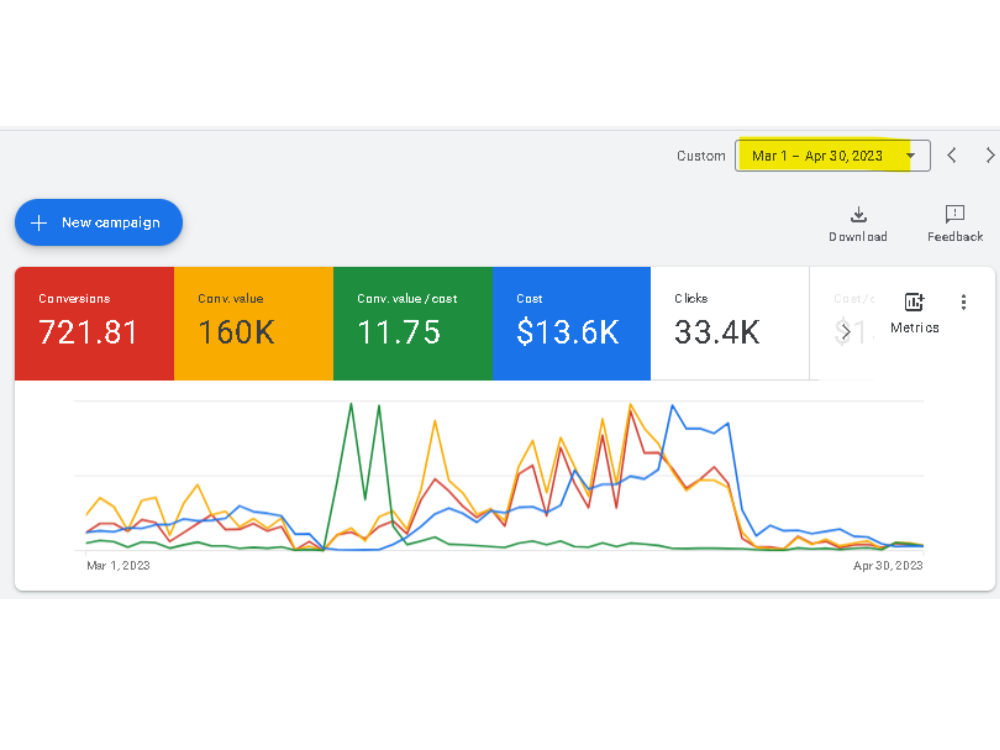
Google Ads best 60-day window ROAS
11.75x ROAS in the best 60-day window (Mar–Apr 2023), rebuilt from scratch.

E-commerce · Google

11.75x ROAS, rebuilt from scratch.

A US/UK fashion store, Google account rebuilt from zero. Best 60-day window, Mar–Apr 2023: 11.75x ROAS, $160K revenue on $13.6K spend on the main store. A second store ran the same playbook at 5.67x.

  • Best 60-day window (Mar–Apr 2023): $160K revenue on $13.6K spend
  • Second store, same playbook: 5.67x, $38.3K on $6.76K
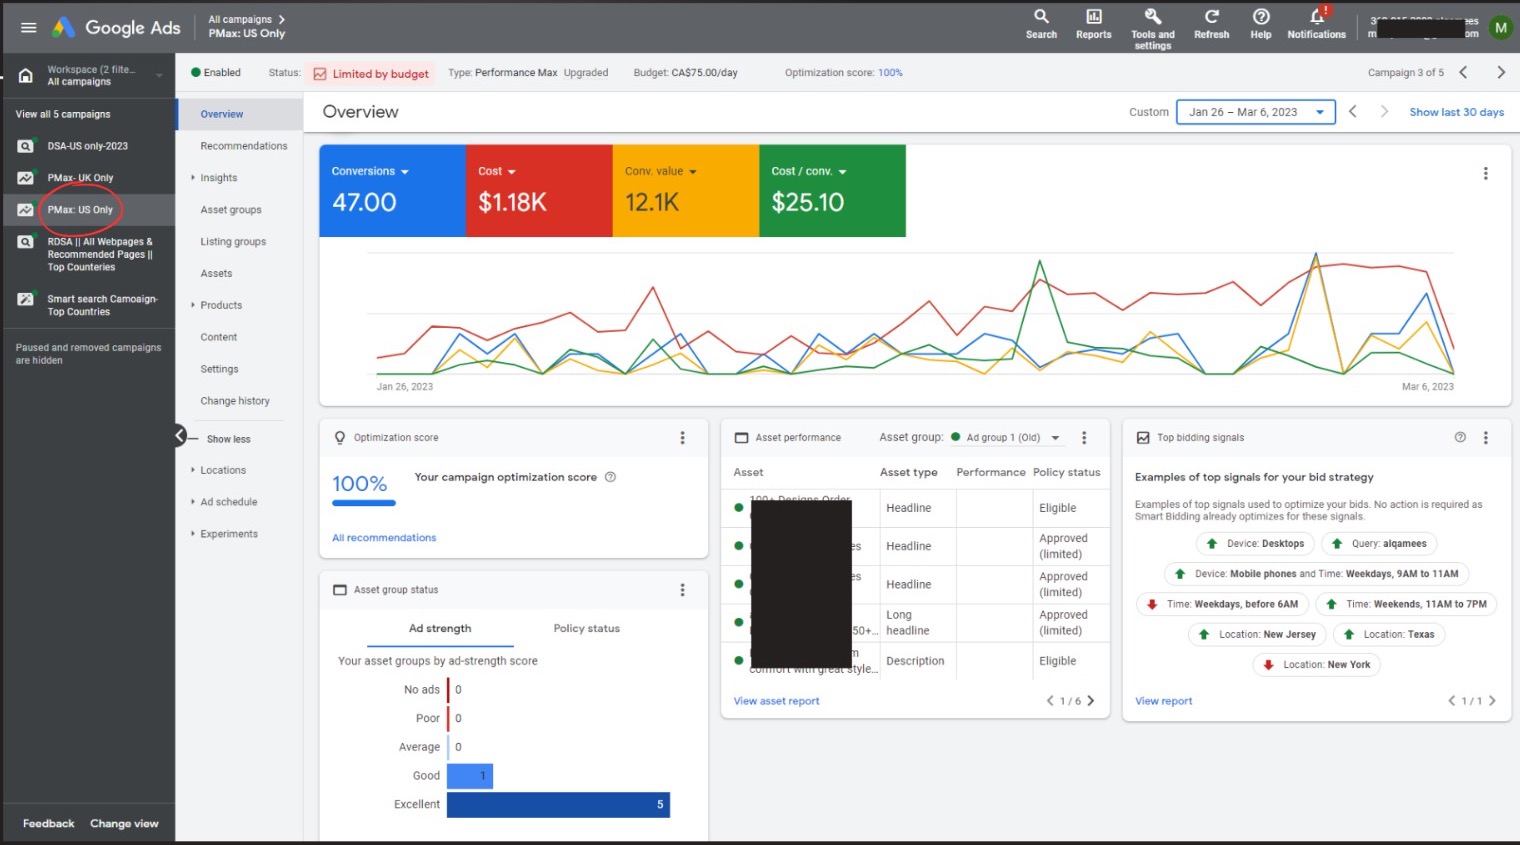
Google Performance Max campaign overview for a US store
10.25x
Performance Max, US store$12.1K conversion value on $1.18K spend
Shopify analytics showing quarterly sales for a UAE store
AED 478,539 total sales in one quarter (+13%), 51.6% returning customers, all channels combined, not paid-only.

E-commerce · Shopify · store level

AED 478K in sales, one quarter.

Store-level results we supported across all channels: AED 478,539 total sales, up 13%. 51.6% returning customers. This is the store’s full revenue, not paid-only, the number the founder banks.

  • AED 478,539 total sales, up 13% on the previous period
  • 51.6% returning customers across the quarter
  • All channels combined, not paid-only

Clinics

Leads a front desk can confirm.

Meta Ads Manager showing clinic campaign totals over 90 days
1,791 leads at AED 48.38 CPL in 90 days, ~22% below the account average.

Clinics · Meta · our campaigns

1,791 leads at AED 48.38, then 1,824 more at AED 53.38.

Campaigns we build and run on a Dubai aesthetic-clinic engagement. 1,791 leads at AED 48.38 CPL over 90 days, then 1,824 leads at AED 53.38 as budget scaled to 15 campaigns. Roughly 22% below the account’s average cost per lead.

  • 1,791 leads · AED 48.38 CPL · AED 86.6K spend · 8 campaigns · 90 days (2026)
  • Then 1,824 leads · AED 53.38 CPL · AED 97.3K spend · 15 campaigns
Meta Ads Manager showing clinic ad sets and lead totals
1,824
Leads at AED 53.38 CPLHeld at scale across 15 campaigns
Meta Ads Manager showing clinic account lifetime totals
The wider account: AED 920K+ lifetime spend, 14,800+ leads, AED 61.82 average CPL. We run media buying here alongside the client’s in-house team.

Clinics · Meta · team account

The wider account.

We run media buying on this account alongside the client’s in-house team: AED 920K+ in lifetime Meta spend, 14,800+ leads, AED 61.82 average CPL across 101 ad sets. Every lead tracked back to the campaign that produced it.

  • AED 920K+ lifetime Meta spend · 14,800+ leads
  • AED 61.82 average CPL across 101 ad sets

In their words

What clients say.

We’d already burned budget with two agencies before this. The difference here was the tracking. For the first time the numbers in Ads Manager actually matched Shopify, so we knew what to scale. We went from breaking even to consistently profitable in the second month.

Omar A.Founder · fashion brand, Dubai

For a clinic, leads are easy. Qualified bookings are the hard part. The campaigns were rebuilt around consultations, not form fills, and our front desk noticed the difference within weeks. The weekly report is short, honest, and in plain language I actually understand.

Dr. Sara K.Medical director · aesthetic clinic, Abu Dhabi

I sell a course, so my margins live and die on cost per acquisition. Usama treated my numbers like his own money, paused things fast, scaled what worked, and never hid a bad week. That honesty is exactly why I’ve stayed.

Faisal M.Creator · online education brand, Sharjah

FAQ

What do buyers ask
about these results?

They are client accounts we work in, which is why the framing changes from card to card. Where the campaigns are ours, the card says so. Where we run media buying alongside a clinic in-house team, the card says that too. Each screenshot shows the account as it stood on the date in its caption, in that account currency.

Conversion value divided by cost at account level in Google Ads, over 90 days, in AED: AED 213,502 of tracked conversion value on AED 39,372 of spend, from 573 conversions across Search, Shopping and Performance Max. It describes the paid channel only. The AED 478,539 quarter on the same store is the store-level figure with every channel included, which is why the two numbers answer different questions.

Because 11.75x was the best 60-day window on that account, in March and April 2023, and presenting it as an annual average would be false. The account had just been rebuilt from zero and the strong window followed the rebuild. A second store running the same playbook came in at 5.67x over its own window, which is the more ordinary result.

Most of that account 14,800+ leads and AED 920K+ of lifetime spend predate our involvement, so claiming the lifetime total as AdGrow work would overstate it. The campaigns we build and run are the 1,791 leads at AED 48.38 and the 1,824 that followed at AED 53.38. The wider account is there as context for the scale we operate at, and each caption says which is which.

Not the client accounts, for the same reason we would not show yours to the next person who asks. On a call we screen-share the figures on this page at account level, including the weeks that went badly, and you can ask about any campaign in the view.

For UAE e-commerce and for Dubai clinics, yes, and they are on this page. For real estate, coaches and information products, and B2B technology we publish method and cited third-party market data, because we hold no account results of our own in those verticals. If that is your sector we will tell you on the call without being asked.

AdGrow in numbers

AED 8M+Combined ad spend managed
5.8xAverage ROAS across accounts
25+Brands and clinics
7+ yearsRunning paid ads

Every account here started
with one honest audit.

Book a strategy call. We’ll audit your business and your ads, and build you a plan to scale, with the benchmarks we will hold ourselves to over the first 90 days.

Senior-led accounts · Transparent reporting · Dubai based

Scroll to Top